
How to implement a Moving Average Crossover strategy in Python
- Amman Kumar
- Feb 25
- 4 min read

Imagine having a smart tool that tells you exactly when to buy and sell stocks without any confusion. Sounds exciting, right?
That’s exactly what the Moving Average Crossover Strategy does! It’s a simple yet powerful method used by traders to spot trends and make informed trading decisions.
But how do you actually set it up using Python with Zerodha’s Kite API?
No worries!
This guide will walk you through everything from logging in to Zerodha, fetching tick-by-tick data, calculating moving averages, implementing the strategy, and placing real buy/sell orders.
By the end, you’ll have a fully functional automated trading system in Python.
So, let’s dive in and build your own trading strategy!
Understanding the Moving Average Crossover Strategy
A moving average (MA) smooths out price fluctuations, making it easier to detect trends. The crossover strategy involves using two moving averages of different periods:
Short-term Moving Average (Fast MA): Reacts quickly to price changes (e.g., 10-day MA).
Long-term Moving Average (Slow MA): Moves slower, providing a broader trend overview (e.g., 50-day MA).
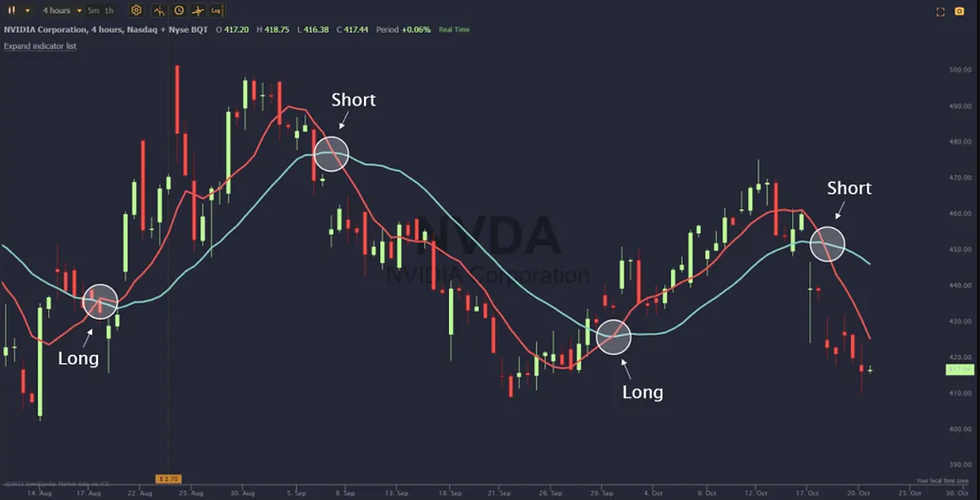
How Does It Work?
Buy Signal (Golden Cross): The short-term MA crosses above the long-term MA, indicating an uptrend.
Sell Signal (Death Cross): The short-term MA crosses below the long-term MA, signaling a downtrend.
This method helps traders capture trends early and exit before reversals occur. However, it is essential to test the strategy under different market conditions to improve its reliability.
Setting Up Python for Zerodha API

Before implementing the strategy, install the necessary Python libraries.
pip install pandas numpy matplotlib kiteconnect
These libraries will help us connect to Zerodha, retrieve stock data, calculate moving averages, and visualize trading signals.
Step 1: Logging in to Zerodha’s Kite API
To access live market data and execute trades, we need to log in to Zerodha Kite API.
Get API Credentials
Sign up for the Kite API at Zerodha Developers.
Generate your API key and API secret.
Authenticate with Kite API
from kiteconnect import KiteConnect api_key = "your_api_key" api_secret = "your_api_secret" kite = KiteConnect(api_key=api_key) # Get request token manually from login URL print("Login URL:", kite.login_url()) # Enter the request token after logging in request_token = "your_request_token_here" # Generate access token data = kite.generate_session(request_token, api_secret=api_secret) kite.set_access_token(data["access_token"]) print("Login successful!")This logs in to Zerodha’s Kite API and retrieves an access token, allowing us to fetch real-time data and place trades.
Step 2: Fetching Live Tick-by-Tick Data
For real-time trading, we need tick data (live price updates). The Kite API provides this using WebSockets.
from kiteconnect import KiteTicker api_key = "your_api_key" access_token = "your_access_token" # Define instrument token for stock (e.g., RELIANCE = 738561)instrument_token = 738561 # Initialize WebSocketkws = KiteTicker(api_key, access_token) # Define callback functions def on_ticks(ws, ticks): print("Live Tick Data:", ticks) def on_connect(ws, response): ws.subscribe([instrument_token]) ws.set_mode(ws.MODE_FULL, [instrument_token]) # Assign functions and start WebSocket kws.on_ticks = on_ticks kws.on_connect = on_connect kws.connect()This script streams live price data for Reliance Industries using WebSockets.
Step 3: Calculating Moving Averages
Now, let's calculate the 10-day and 50-day moving averages using historical price data.
Fetching Historical Data
import pandas as pd # Fetch last 60 days of data historical_data = kite.historical_data(738561, "2024-01-01", "2024-06-01", "day") df = pd.DataFrame(historical_data) Computing Moving Averages
df['Short_MA'] = df['close'].rolling(window=10).mean() df['Long_MA'] = df['close'].rolling(window=50).mean() print(df[['date', 'close', 'Short_MA', 'Long_MA']].tail())This calculates and stores moving averages in the dataframe.
Step 4: Implementing Buy and Sell Signals
We generate buy/sell signals based on moving average crossovers.
df['Signal'] = 0 df.loc[df['Short_MA'] > df['Long_MA'], 'Signal'] = 1 # Buy Signal df.loc[df['Short_MA'] < df['Long_MA'], 'Signal'] = -1 # Sell Signal print(df[['date', 'close', 'Short_MA', 'Long_MA', 'Signal']].tail())1 → Buy signal
-1 → Sell signal
Step 5: Placing Buy and Sell Orders in Zerodha
Now, let’s automate order placement using Zerodha’s API.
Buy Order
def place_order(symbol, quantity, order_type): order_id = kite.place_order( tradingsymbol=symbol, exchange=kite.EXCHANGE_NSE, transaction_type=order_type, quantity=quantity, order_type=kite.ORDER_TYPE_MARKET, product=kite.PRODUCT_MIS ) print(f"Order placed: {order_id}") # Example: Buy 10 shares of Reliance place_order("RELIANCE", 10, kite.TRANSACTION_TYPE_BUY)Step 6: Exiting Orders (Stop Loss & Profit Booking)
To limit risk and secure profits, add stop-loss and target price orders.
def place_sl_order(symbol, quantity, price, stoploss): kite.place_order( tradingsymbol=symbol, exchange=kite.EXCHANGE_NSE, transaction_type=kite.TRANSACTION_TYPE_SELL, quantity=quantity, order_type=kite.ORDER_TYPE_SL, product=kite.PRODUCT_MIS, price=price, trigger_price=stoploss) # Example: Sell if price drops to 2500 place_sl_order("RELIANCE", 10, 2550, 2500)This automatically exits the trade if the price drops below the stop-loss level.
Final Thoughts
The Moving Average Crossover Strategy is a simple yet effective way to identify trends.
Using Zerodha’s Kite API, we successfully logged in, streamed live tick data, calculated moving averages, generated buy/sell signals, and placed real orders.
To enhance performance, consider optimizing moving average parameters, adding stop-loss rules, or using additional indicators like RSI or MACD.
This guide provides a solid foundation for automated trading. Now, tweak it, test it, and refine it for better trading results!
Frequently Asked Questions
What is the best period for moving averages?
There is no universal answer. The commonly used setup is 10-day (fast) and 50-day (slow) moving averages, but it depends on market conditions and asset volatility.
Can this strategy be applied to cryptocurrency trading?
Yes, it works for stocks, forex, and cryptocurrency. However, since crypto markets are highly volatile, additional confirmation indicators may be necessary.
How can I reduce false signals?
Combining moving averages with RSI, MACD, or Bollinger Bands can help filter out weak signals and improve trade accuracy.
Is this strategy suitable for day trading?
Yes. Using shorter moving averages (e.g., 5-minute vs. 30-minute MAs) is better suited for intraday trading, helping traders react to short-term price movements.
Can this strategy be automated?
Yes. It can be connected to platforms like Zerodha Kite API, Alpaca, Interactive Brokers, or Binance API for automated trade execution.


From where 2 get api key ?